TRACING THE
FLOODS
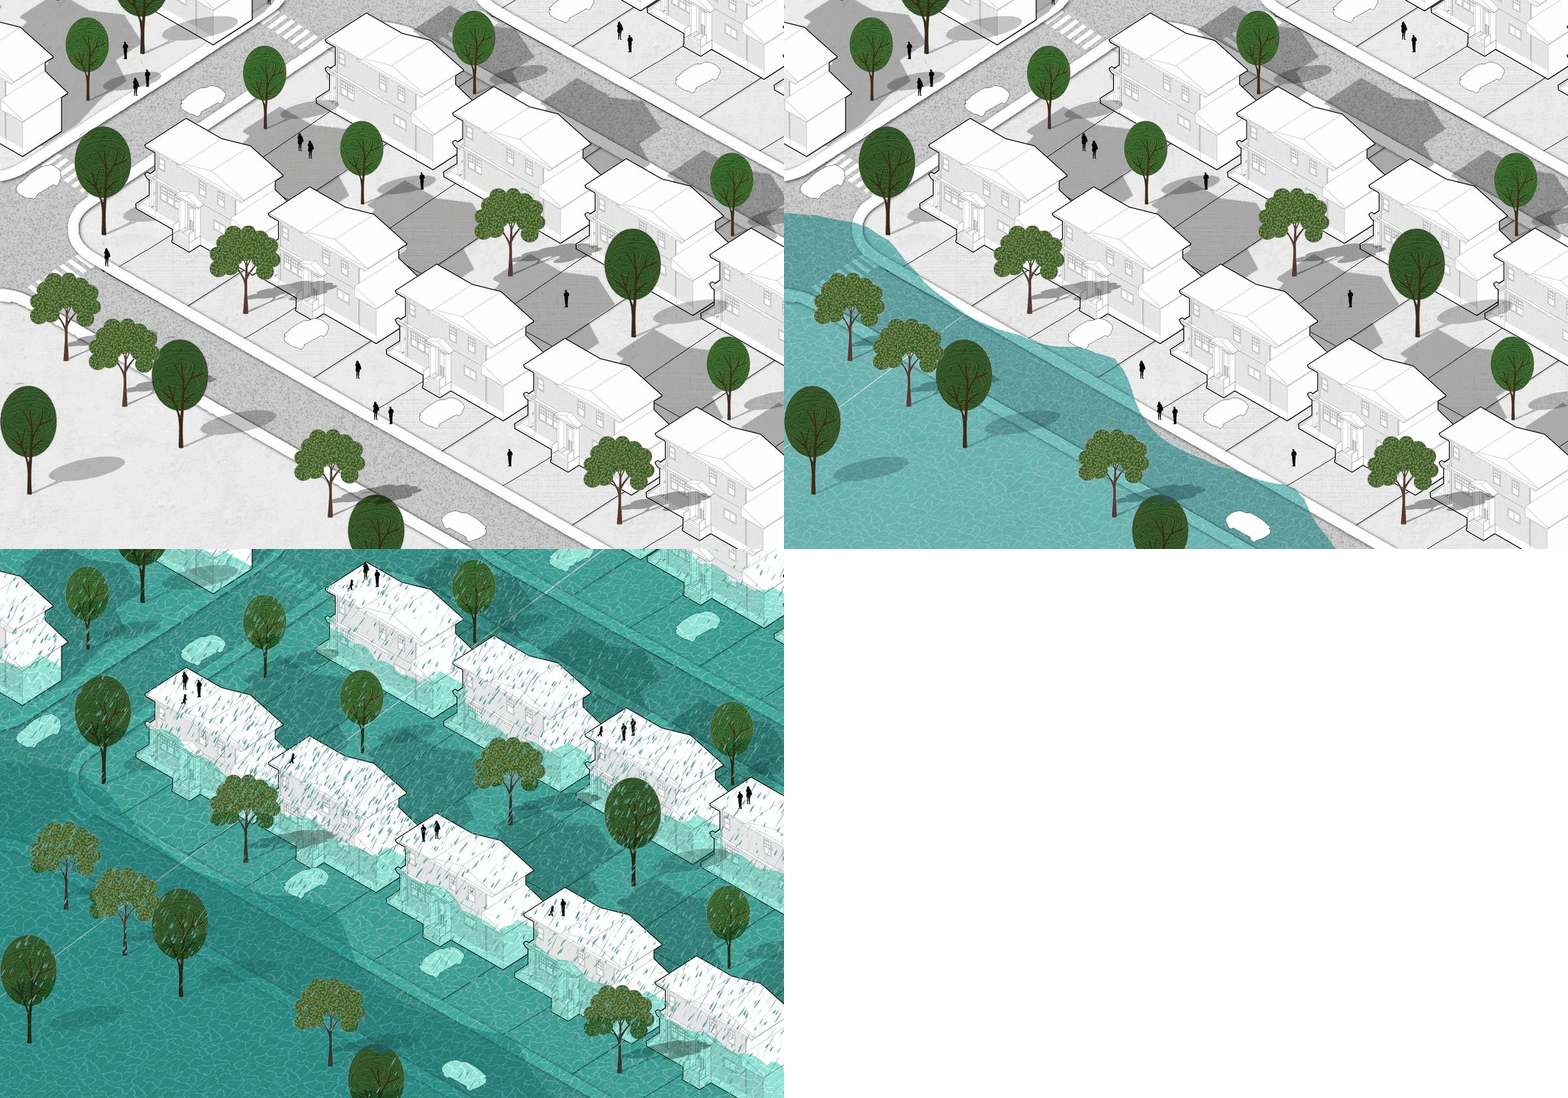
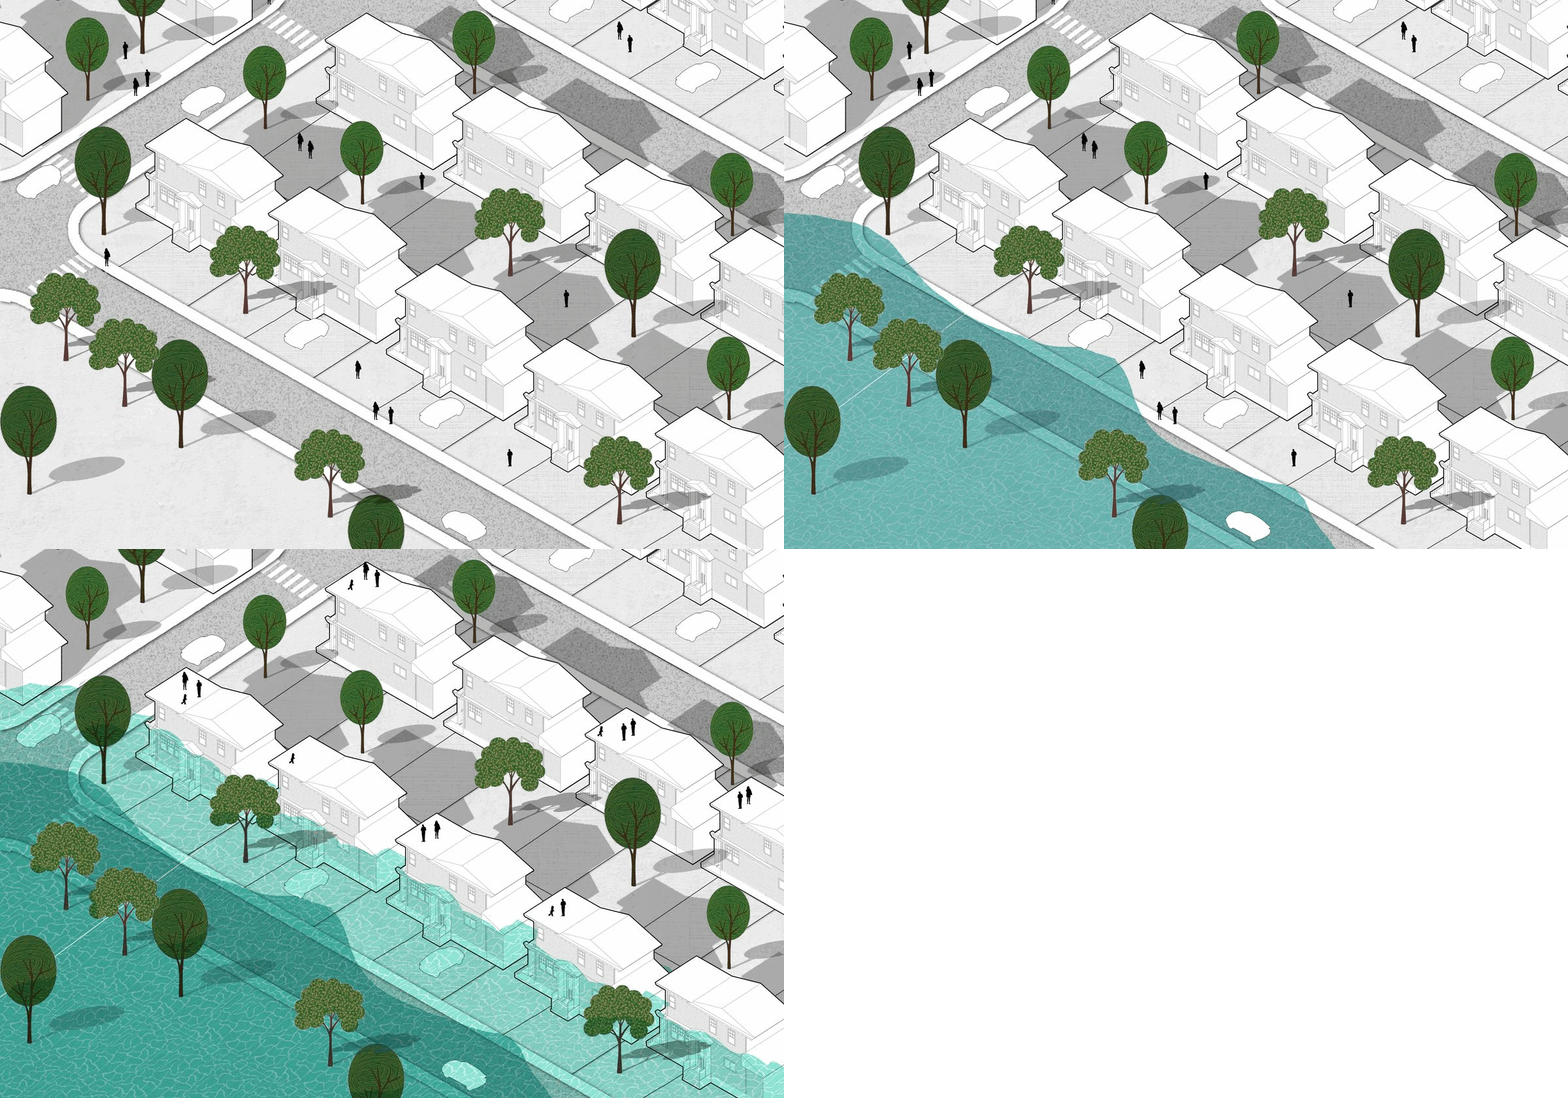
As coastal shores grow in population, more people expose themselves to the risks of potential sea-level rise and flooding. These threats are aggravated by the climate crisis which contributes to erratic storms, storm surges, and shoreline erosion. Through our, (me and my teammate) research and intervention we want to examine the dramatic change in flooding conditions of Staten Island and use it as a proxy to understand the potency of reclaiming wetlands in other endangered sites across the world. Staten Island is located in the southernmost part of New York and is called as the lesser-known borough. It has a population of less than 500,000, making it the least populous borough of New york state. Staten Island saw an influx of tourists and urbanisation during the early 90’s when the connectivity of the island improved. In the following years, Due to this rapid development, the island started facing the repercussions of these developments like flooding. To control those, the various departments of NYC have actively taken initiatives to amend these issues. As one of the interventions, a trail meandering through the site traces this inundation using its shape from below and acts as a walking/ evacuation path from above was created. The silhouette of this trail is decided on the basis of the ground it sits on and the trees it passes through. The trail is designed inorder to be as minimally invasive to the Bluebelt as possible. Acknowledging the inevitability of climate crisis, the trail also performs the role of evacuation zones.. This inturn becomes a proxy to our flood conditions in Staten Island.
Semester : Summer
Site Area : East shore
Duration : May-July’22 Location : East Shore, Staten
Island, NYC
Faculty : Marco Ferrari, Elise
Hunchuck
School : GSAPP
Studio : Proxy Landscapes

IAN MC HARG’S LAND SUITABILITY, source: ian mcharg design
In the 1960s, Ian McHarg examined land-use suitability for Staten Island with attention to ecological planning by analyzing physical and cultural characteristics of land features and biophysical vulnerabilities to spot the areas that are least suitable for urbanization in the city.

LAND-USE, source: nyc.gov
Staten Island saw an influx of tourists and urbanization during the early 90s when the connectivity of the island improved. In the following years, the rapid development led to the island facing repercussions like flooding.

UNSUITABLE FOOTPRINT, source: ian mcharg design with nature
The current building footprint of Staten Island overlays in some areas with the unsuitable urbanization zoning suggested by McHarg. 16.5% of the total population lives within the Hurricane Sandy Inundation Zones. A dominant number of those people belong to the East shore.

HURRICANES AND FLOODS, source: fema.gov
The East Shore has been vulnerable to flooding and hurricanes in the past. A large amount of the East Shore was affected by Superstorm Sandy in 2012 as already suggested by McHarg.

LAND-USE, source: nyc.gov
The East Shore has a high vulnerability to flooding. The dense and varied development in the area, along with the extent of the 1% annual chance floodplain, means that over 10,000 residential units are within the Preliminary Flood Insurance Rate Maps.

RESIDENTIAL RISK FACTOR, source: riskfactor.com
The number of homes at risk is classified as minor, moderate, and major. Where 1410 houses are minor at risk, 3516 are at moderate, and 4609 are at major risk factor. These include residences beyond the FEMA flood insurance lines.

CRITICAL RISK FACTOR, source: riskfactor.com
Critical infra includes hospitals, police stations, fire stations, airports, sea ports, power stations and waste water treatment facilities. Out of these 26 properties on site, 10 are at risk of flooding

URBAN INFRASTRUCTURE RISK FACTOR, source: riskfactor.com
50 miles of road out of 141 are at a minor risk of getting flooded in these zones whereas 108 miles of roads are susceptible to moderate risk

COMMERCIAL RISK FACTOR, source: riskfactor.com
324 properties are in these zip codes which are facing a moderate risk of flooding. 282 are at major risk and 352 are in fact facing severe risk factors.

SEA-WALL, source: thenyc.gov
Upon planned completion in 2023, the hybrid system of armored levees and buried sea walls called the Line of Protection will reduce flood risk. The plan also involves a complementary interior drain plan with tidal gates, road elevations, and excavations.

BUY-OUT PROGRAM, source: mcghee, duke university
The majority of participants in the managed retreat program relocated to zip codes 10306, 10312, 10314, and 10308. Nearly 40% of all the buyout participants who relocated within Staten Island relocated to 10305 and 10306.

BLUE BELTS, source: nyc.gov
Blue belts are ecologically rich and cost-effective drainage systems that naturally handle the runoff precipitation that falls on our streets and sidewalks. The combination of ecology with technology, indigenous to its location can also help.


The concept of this intervention is to map the vertical flow of that inundation. The pathway becomes a visual representation of the flooding conditions improved by bluebelts. Hence a proxy of flooding conditions and its relationship to Bluebelts becomes the information through which other sites in the world can realise the potency of Bluebelts.
NC -11 BLUEBELT
Bluebelts have consistently proven to improve flood-prone sites by controlling the run-off which would otherwise inundate the chosen site by ten feet. The site also consists on shallow emergent marsh land, and swamps- thereby making the outermost later the most adaptive to an intervention.


